MMU SEM quarterly reports
Before the production of a monthly SEM market monitoring reports, a quarterly analysis was published. Below shows a snapshot of the key market trends from the last market quarterly reports. For more detail or copies of the full reports, please visit the MMU section of the SEM Committee website.
| January 2022 - March 2022 (Q1) |
|---|
The graph below shows the daily average DAM price and volume in the market in Q1 2022.
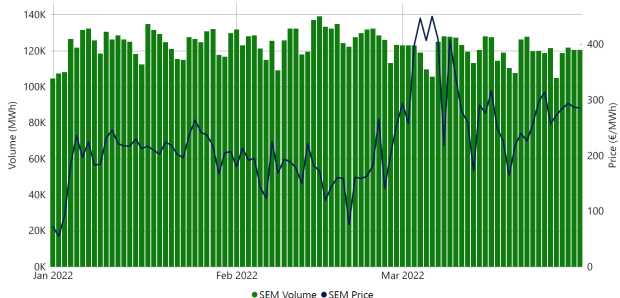
Prices in the day-ahead market were €224.86/MWh for Q1 2022. This is on par with Q4 of 2021.
This was primarily due to increased input costs (mainly wholesale fuel prices, in particular Gas and Coal prices) and increased carbon costs while an increase in wind did have a slight dampening effect on prices.
Liquidity continues to be concentrated in the day-ahead market with over 86.73% of ex-ante volumes traded with an overall value of over €2.54 billion.
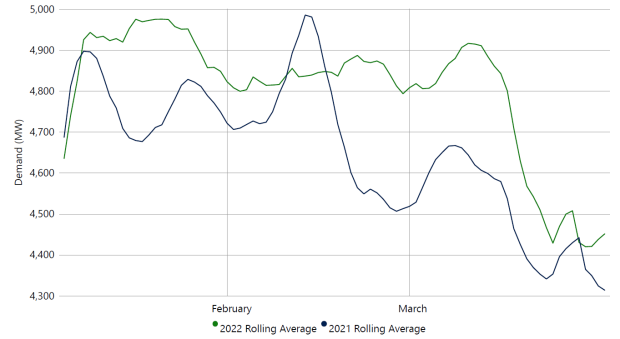
Overall, actual system demand across the quarter has remained above the levels seen when compared to the same period in 2021.
| October 2021 - December 2021 (Q4) |
|---|
The graph below shows the daily average DAM price and volume in the market in Q4 2021.
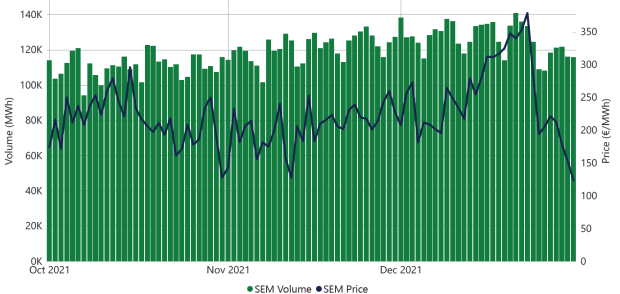
Prices in the day-ahead market were €172.45 higher than the Q4 in 2020.
This is primarily due to increased wholesale fuel prices and carbon costs. The average wind forecast across the quarter was 1872MW compared to 798MW in Q3, 134% higher than the previous quarter.
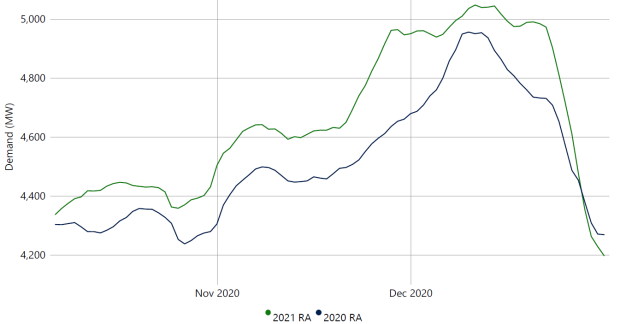
Overall system demand across the quarter has remained above the demand seen in the same period in 2020. A contributing factor for the difference is also COVID-19 governmental restrictions.
| July 2021 - September 2021 (Q3) |
|---|
The graph below shows the daily average DAM price and volume in the market in Q3 2021.
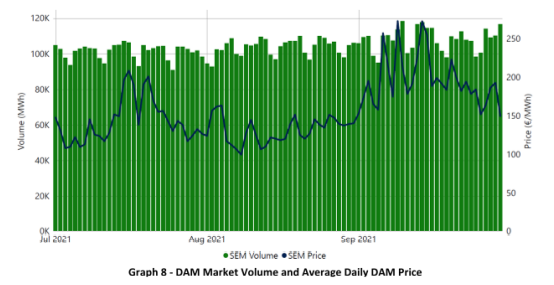
Prices in the day-ahead market were €63.96 higher than the Q2 in 2021, a 69.2% increase.
Higher market prices over this period were due to increased input costs, mainly wholesale fuel prices and carbon costs as well as reduced wind forecasts. The average wind forecast across the quarter was 798MW compared to 1190MW in Q2, 32.9% lower than the previous quarter.
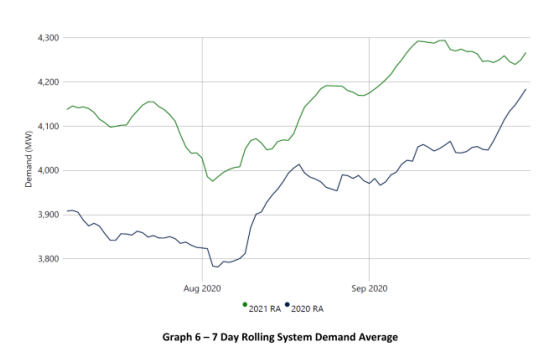
Overall system demand across the quarter has remained above the demand seen in the same period in 2020. A contributing factor for the difference is also COVID-19 governmental restrictions.
| April 2021 - June 2021 (Q2) |
|---|
The graph below shows the daily average DAM price and volume in the market in Q2 2021.
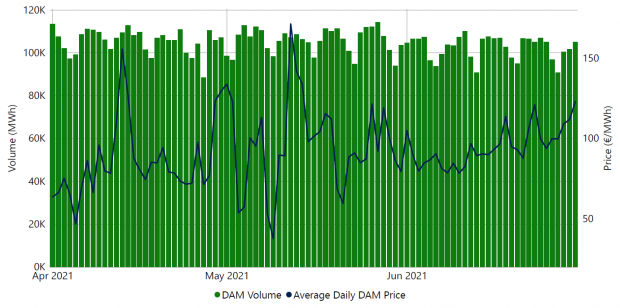
Prices in the day-ahead market were €22.46 higher than the Q1 in 2021, a 32.1% increase.
Higher market prices over this period were due to increased wholesale fuel prices and carbon costs as well as reduced wind forecasts. The average wind forecast across the quarter was 39.87% lower than the previous quarter.
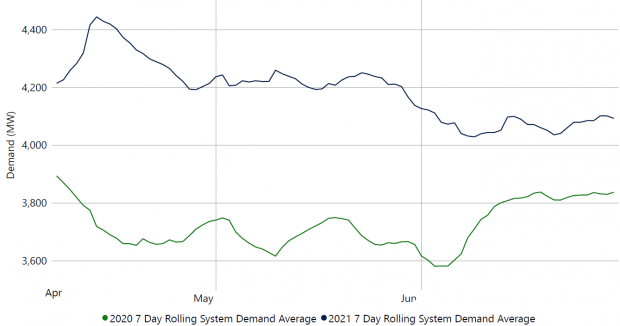
Overall system demand across the quarter has remained above the demand seen in the same period in 2020. Government restrictions resulting from the Covid-19 pandemic were the primary cause for the difference in demand.
| January 2021 - March 2021 (Q1) |
|---|
The majority of electricity is traded in the day ahead market. The graph below shows the daily average DAM price and volume in the market in Q1 2021.
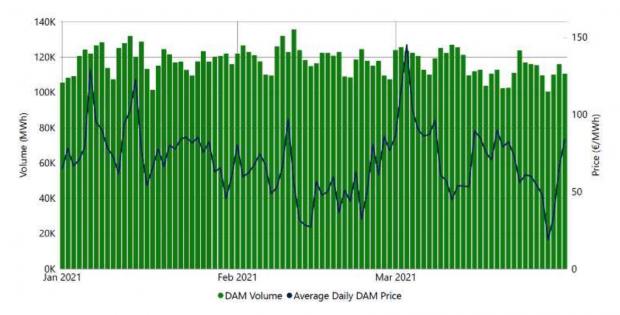
The average daily price in the DAM was €69.98/MWh during the period, up from €50.97/MWh in Q4 2020, a 37.3% increase. This is a 91.83% increase compared to the same period last year.
Higher market prices over the period were due to increased gas and carbon costs, coupled with lower forecasted wind on the system and several units being unavailable. Lower prices continue to be linked to periods of high wind availability, with higher prices seen when wind availability is low.
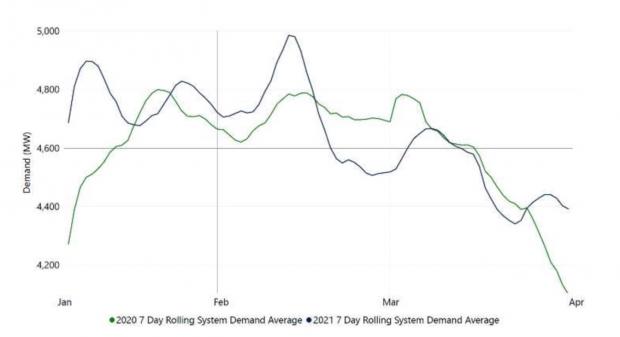
Overall system demand across the quarter has generally remained above or close to the levels seen when compared to the same period last year.
| October 2020 - December 2020 (Q4) |
|---|
The graph below shows the daily average DAM price and volume in the market in Q4 2020
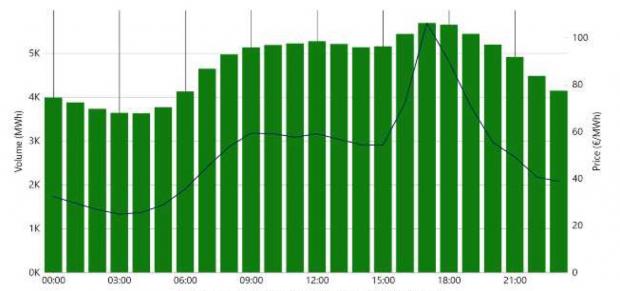
The average daily price in the DAM was €50.97/MWh during the period, up from €37.02/MWh in Q3 2020, a 37.7% increase. This is a 10.54% increase compared to the same period last year.
Higher market prices over the period were due to increased gas prices and demand.
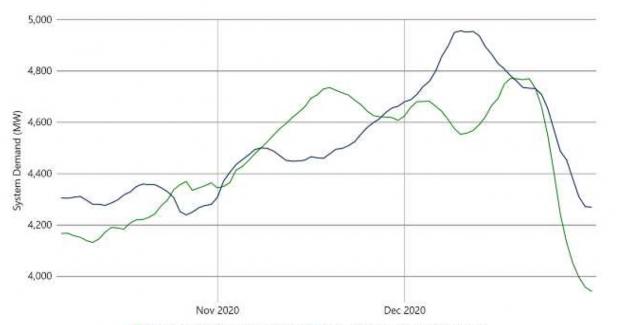
Overall system demand across the quarter has generally remained above levels seen when compared to the same period last year.
| July 2020 - 30 September 2020 (Q3) |
|---|
The graph below shows the daily average DAM price and volume in the market in Q3 2020.
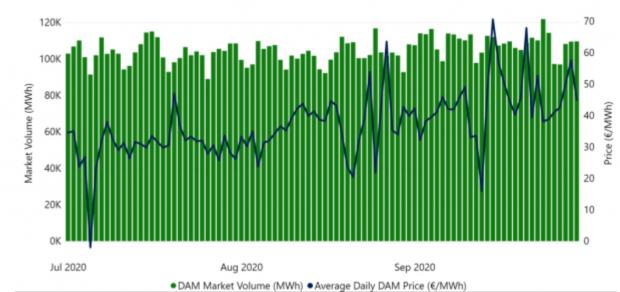
The average daily price in the DAM was €37.02/MWh during the period, up from €25.81/MWh in Q2 2020, a 43.4% increase. This is a 20.7% decrease compared to the same period last year.
Lower market prices compared to the same period last year were due to a decrease in gas prices and increasing levels of forecasted wind.
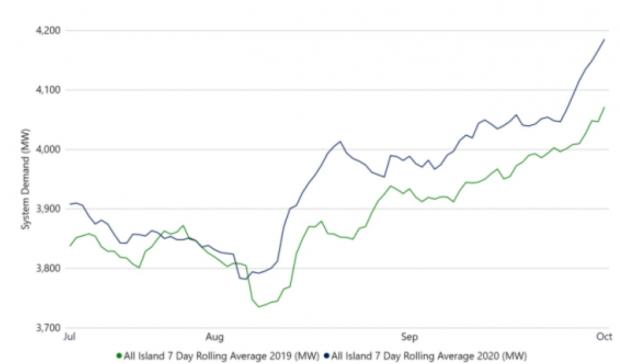
Overall system demand across the quarter has generally remained at similar levels to those seen in the same period last year.